PowerPack Advanced Charts widgets offer 7 different chart types that allow you to add interactive charts to your WordPress websites using Elementor.
In this doc, we will learn how to create a radar chart in Elementor using the PowerPack Advanced Charts widget!
Create a Radar Chart in Elementor#
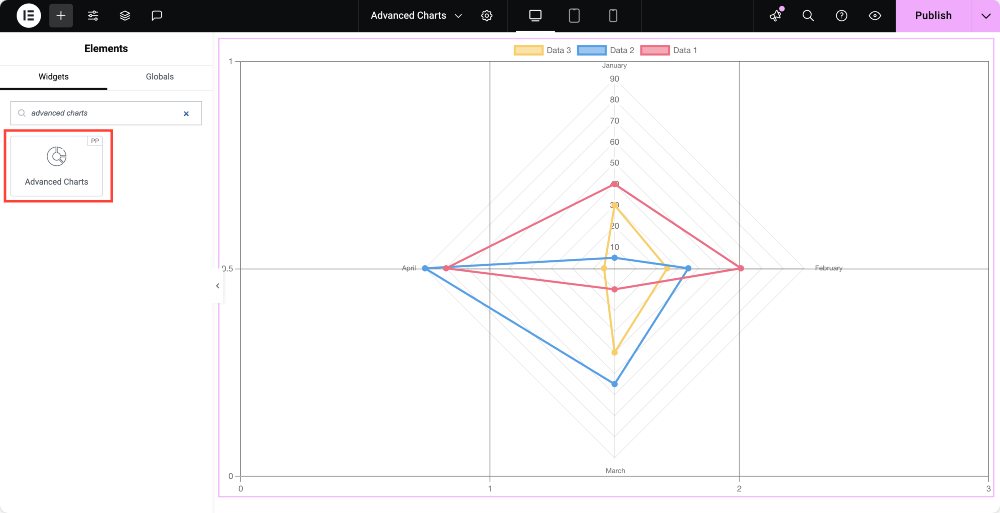
1. Add the PowerPack Advanced Charts Widget#
- Open your WordPress Dashboard and create a new page or edit an existing one.
- Drag and drop the PowerPack Advanced Charts widget onto your Elementor canvas.
2. Configure the Chart Settings#
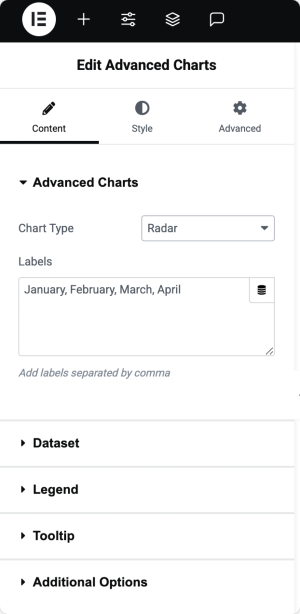
Advanced Charts#
- From the Chart Type dropdown, choose Radar to create a radar chart.
- Define the Labels for your chart to categorize the data.
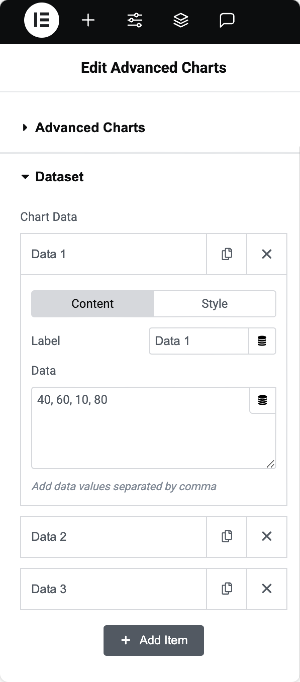
Dataset#
- Enter the data values for your chart. You can add as many values as needed.
- Each dataset can be individually styled using the available design options.
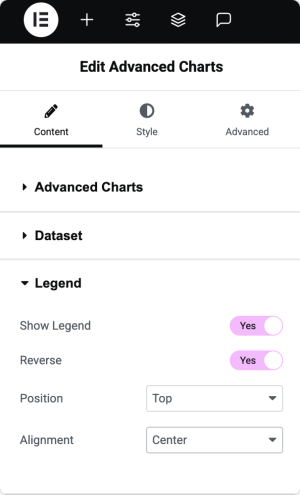
Legend#
- Enable Show Legend to display the chart legend.
- Enable Reverse to display the legend in reverse order.
- Adjust the legend Position (Left, Top, Bottom, or Right).
- Set the legend Alignment (Start, Center, or End).
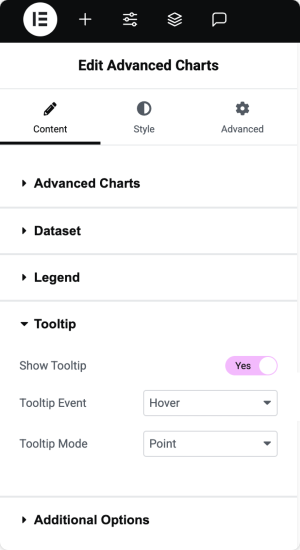
Tooltip#
- Enable Show Tooltip to display tooltips when interacting with the chart.
- Choose a Tooltip Event: Hover or Click.
- Select a Tooltip Mode:
- Index: Displays tooltips for all datasets at the hovered point.
- Point: Shows tooltips for individual data points.
- Dataset: Displays tooltips for the entire dataset.
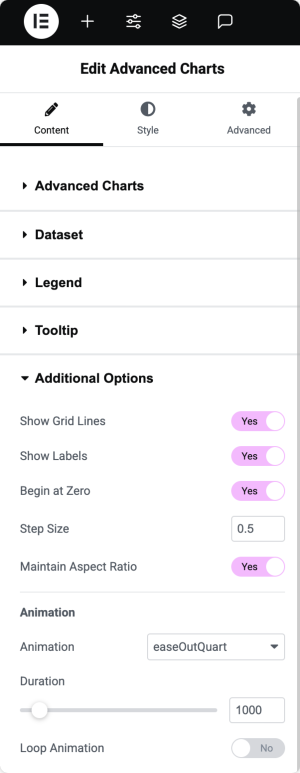
Additional Options#
- Show Grid Lines: Enable to display grid lines for better readability.
- Show Labels: Enable to show labels on the chart.
- Begin at Zero: Ensures the Y-axis starts at zero.
- Step Size: Define the step size for the Y-axis.
- Maintain Aspect Ratio: Enable to keep the chart’s aspect ratio.
- Animation Options: Choose from different animations such as Linear, easeInQuad, easeOutQuad, easeInOutQuad, and more.
- Duration: Set the animation duration.
- Loop Animation: Enable to loop the animation continuously.
This is how you can create a fully customized Radar Chart in Elementor using the PowerPack Advanced Charts widget!