PowerPack’s Advanced Charts widget provides seven different chart types, allowing you to add interactive and stylish charts to your Elementor-powered WordPress website.
In this guide, we’ll walk you through the process of creating a Pie Chart in Elementor using the PowerPack Advanced Charts widget.
Create a Pie Chart in Elementor#
1. Add the PowerPack Advanced Charts Widget#
- Open your WordPress Dashboard and create a new page or edit an existing one.
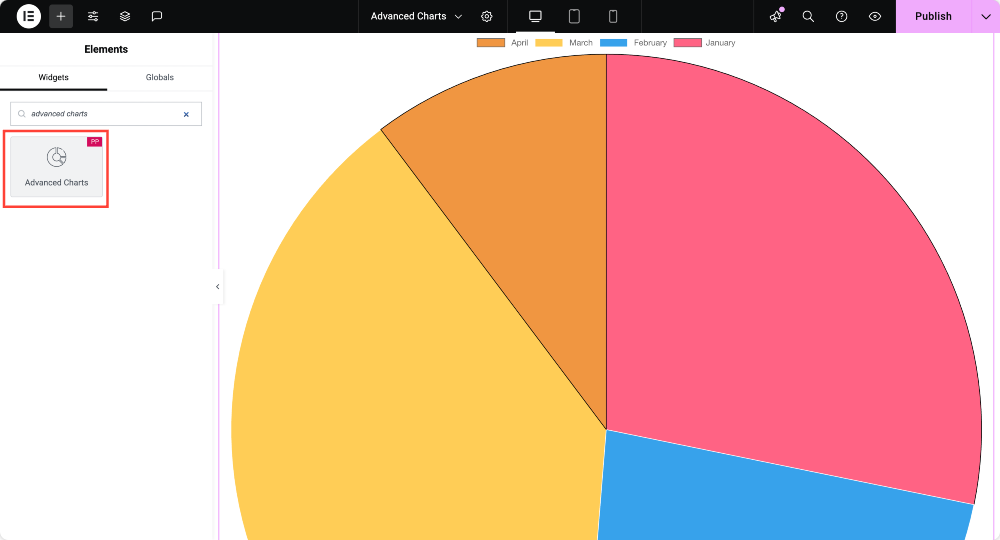
- Launch Elementor and drag the PowerPack Advanced Charts widget onto the canvas.
2. Configure the Chart Settings#
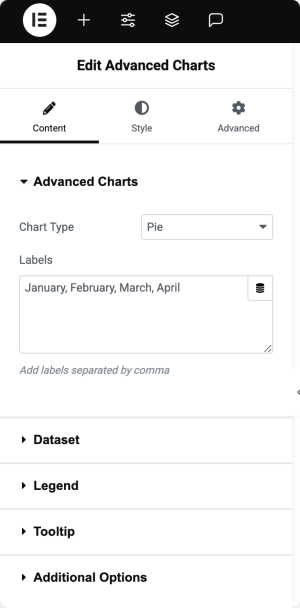
Chart Type #
- Under the Chart Type dropdown, select Pie to generate a pie chart.
- Define the Labels to categorize the data segments within your pie chart.
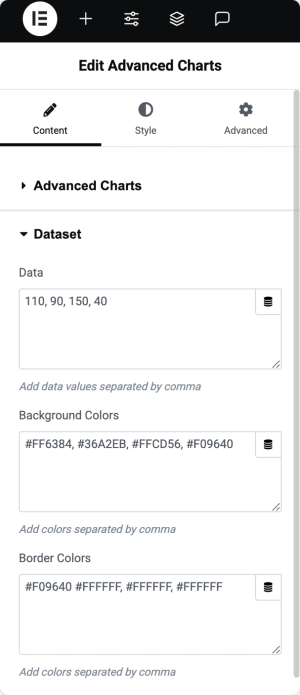
Dataset#
- Data: Enter the numerical values that will represent each segment of the pie chart. You can add multiple values as needed.
- Background Colors: Assign different colors to each segment for better visual distinction.
- Border Colors: Define the outline color for each segment.
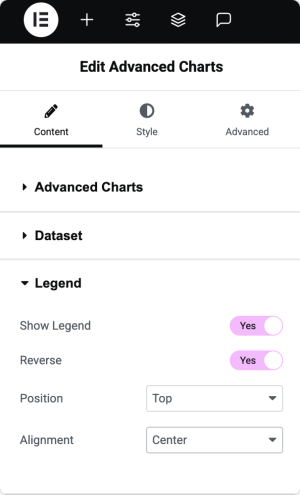
Legend#
- Show Legend: Enable this option to display the legend for the chart.
- Reverse: Toggle this option to display the legend items in reverse order.
- Position: Choose where to display the legend—Left, Top, Bottom, or Right.
- Alignment: Adjust the legend alignment to Start, Center, or End.
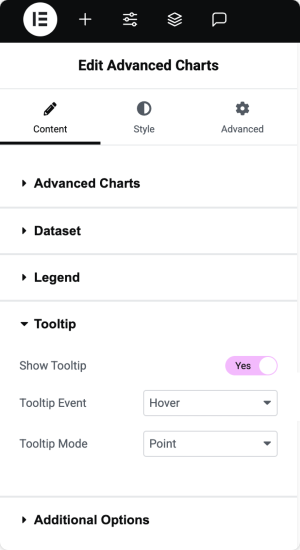
Tooltip#
- Show Tooltip: Enable tooltips to display information when interacting with the chart.
- Tooltip Event: Choose between Hover or Click for triggering tooltips.
- Tooltip Mode: Select how the tooltips appear:
- Index: Shows tooltips for all datasets at the hovered point.
- Point: Displays tooltips for individual data points.
- Dataset: Shows tooltips for the entire dataset at once.
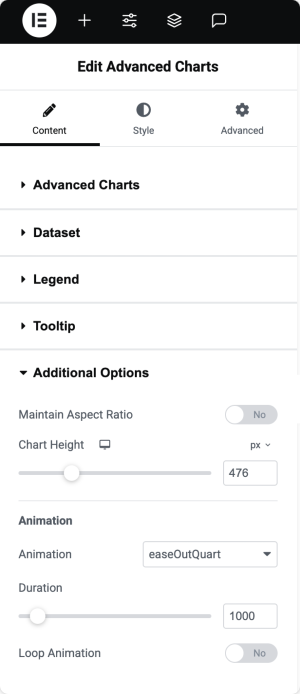
Additional Options#
- Maintain Aspect Ratio: Enable this setting to preserve the chart’s proportions.
- If disabled, you can manually set the Chart Height for a custom layout.
- Animation Settings: Choose from different animation effects such as Linear, easeInQuad, easeOutQuad, easeInOutQuad, and more.
- Duration: Set the animation duration to control how long the animation effect lasts.
- Loop Animation: Enable this option to create a continuous looping animation effect.
This is how you can create a fully customized Pie Chart in Elementor using the PowerPack Advanced Charts widget!