PowerPack's Advanced Charts widget offers seven different chart types, allowing you to add dynamic, interactive charts to your WordPress website using Elementor.
In this guide, we'll walk you through the process of creating a Doughnut Chart using the PowerPack Advanced Charts widget.
Create a Doughnut Chart in Elementor#
1. Add the PowerPack Advanced Charts Widget#
To begin:
- Open your WordPress Dashboard and either create a new page or edit an existing one using Elementor.
- Search the PowerPack Advanced Charts widget in the Elementor panel.
- Drag and drop the widget onto your page.
2. Configure the Chart Settings#
Once the widget is added, configure the settings to create your Doughnut Chart.
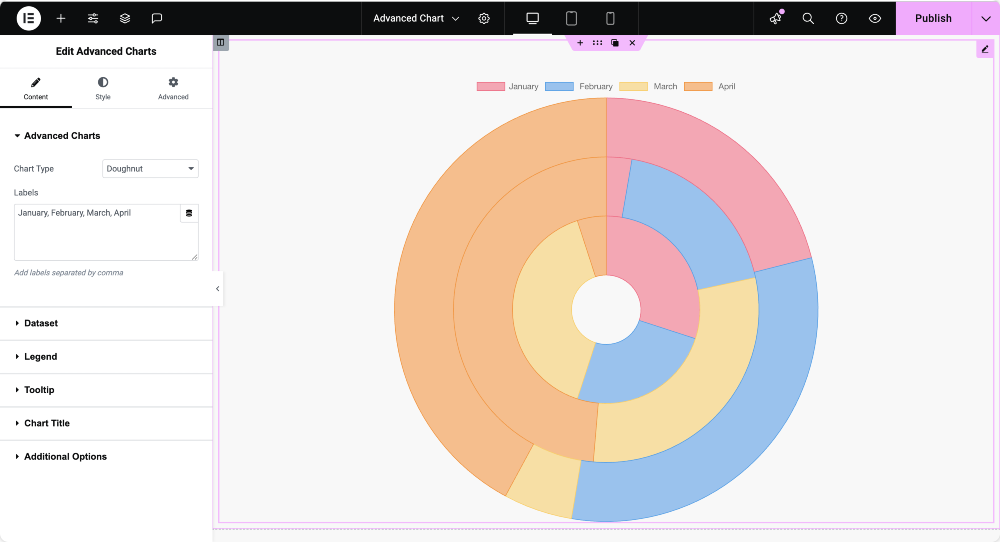
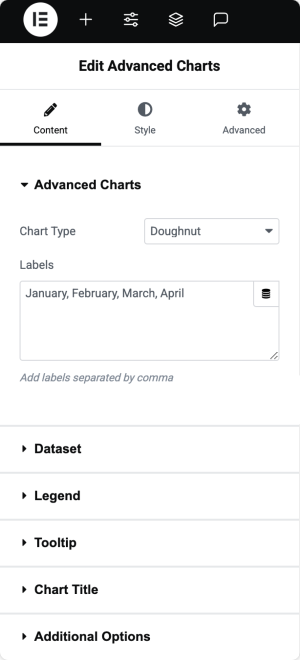
Advanced Charts#
- Chart Type: From the dropdown menu, select Doughnut to display data in a circular format with a cut-out center.
- Labels: Define category labels for your chart to represent different data groups.
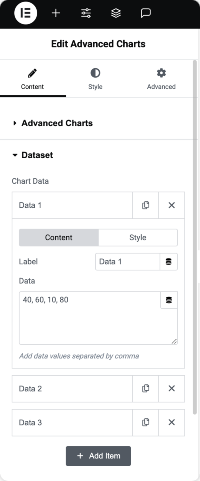
Dataset#
- Data: Enter the values that will be plotted on the chart. You can add multiple data points as needed.
- Background Colors: Set distinct background colors for different data segments.
- Border Colors: Customize border colors for improved visibility.
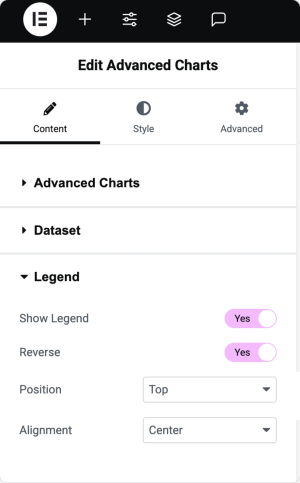
Legend#
- Show Legend: Enable this option to display a legend that helps users identify chart categories.
- Reverse: Enable this option to display the legend items in reverse order.
- Position: Choose from Left, Top, Bottom, or Right to define the placement of the legend.
- Alignment: Set the alignment to Start, Center, or End for better layout control.
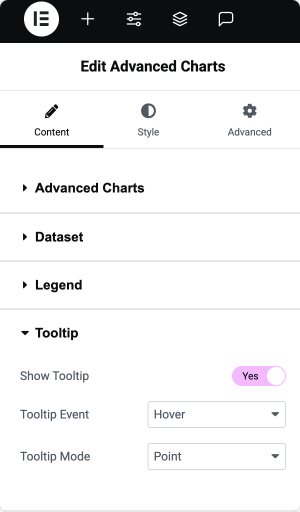
Tooltip#
- Show Tooltip: Enable this option to display additional information when interacting with the chart.
- Tooltip Event: Choose how tooltips should be triggered on Hover or Click.
- Tooltip Mode: Select how tooltips display data:
- Index: Shows tooltips for all datasets at the hovered point.
- Point: Displays tooltips for individual data points.
- Dataset: Shows tooltips for the entire dataset.
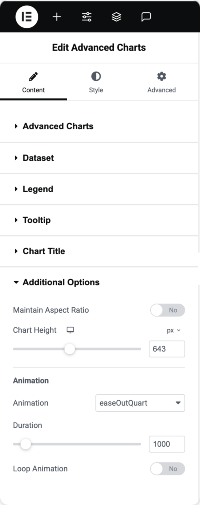
Additional Options#
- Maintain Aspect Ratio: Enable this option to keep the chart's proportions intact.
- If disabled, you can manually set the Chart Height for a custom layout.
- Animation Options: Choose from various animation styles like Linear, easeInQuad, easeOutQuad, easeInOutQuad, and more.
- Duration: Set the animation duration to control how long the chart animation lasts.
- Loop Animation: Enable this option to repeat the animation continuously.
This is how you can create a fully customized Doughnut Chart in Elementor using the PowerPack Advanced Charts widget.