PowerPack’s Advanced Charts widget offers 7 different chart types, allowing you to add interactive and stylish charts to your WordPress website using Elementor.
In this guide, we’ll walk you through the process of creating a bar graph using the PowerPack Advanced Charts widget.
Create a Bar Graph in Elementor#
1. Add the PowerPack Advanced Charts Widget#
- Open your WordPress Dashboard and either create a new page or edit an existing one using Elementor.
- Drag and drop the PowerPack Advanced Charts widget onto the Elementor canvas.
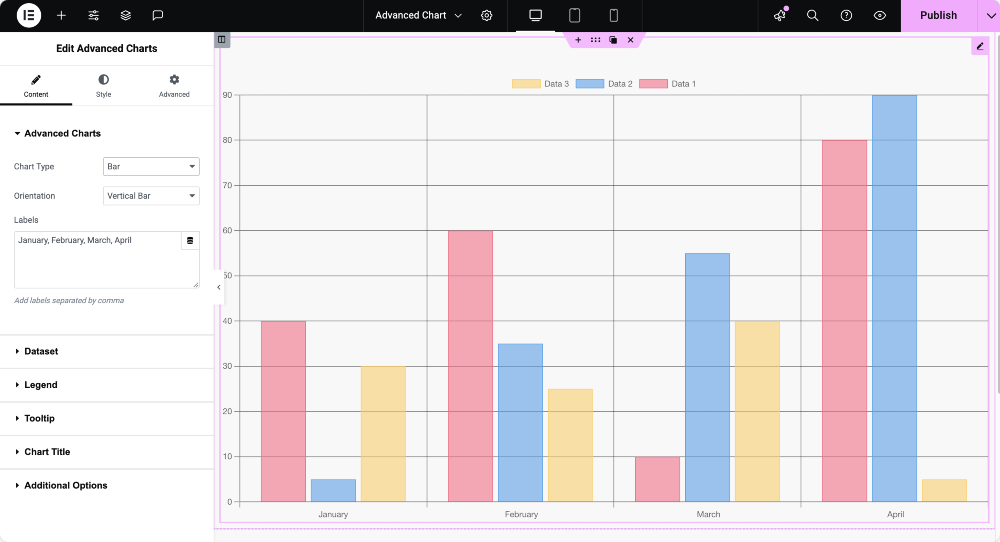
2. Configure the Chart Settings#
Chart Type & Orientation#
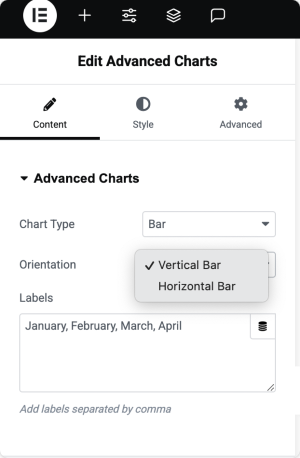
- From the Chart Type dropdown, select Bar to create a bar graph.
- Choose the Orientation:
- Vertical Bar
- Horizontal Bar
- Define the Labels to categorize your data effectively.
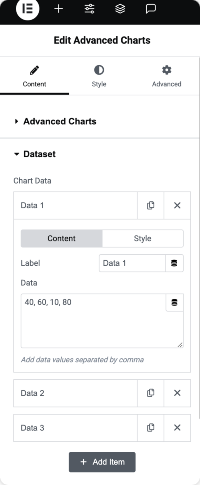
Dataset #
- Enter the data values for your chart. You can add multiple datasets.
- Customize each dataset’s appearance using the available styling options.
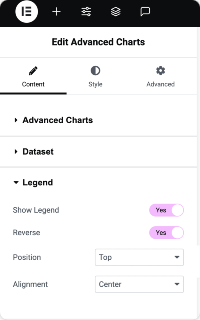
Legend #
- Enable Show Legend to display a legend for your chart.
- Enable Reverse to arrange the legend items in reverse order.
- Adjust the Legend Position to Left, Top, Bottom, or Right.
- Set the Legend Alignment to Start, Center, or End.
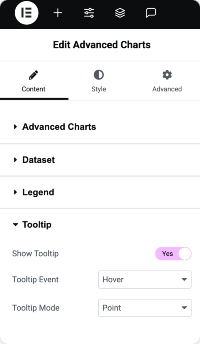
Tooltip#
- Enable Show Tooltip to display tooltips when users interact with the chart.
- Choose a Tooltip Event:
- Hover – Tooltips appear when hovering over data points.
- Click – Tooltips appear when clicking data points.
- Select a Tooltip Mode:
- Index – Displays tooltips for all datasets at a hovered point.
- Point – Shows tooltips for individual data points.
- Dataset – Displays tooltips for the entire dataset.
Additional Options#
- Show Grid Lines – Enable to display grid lines for better readability.
- Show Labels – Enable to display labels on the chart.
- Begin at Zero – Ensures the Y-axis starts from zero.
- Step Size – Define the interval between Y-axis values.
- Maintain Aspect Ratio – Preserve the chart’s proportions.
- Stacked – Enable to stack datasets on top of each other.
- Animation Options – Choose from various animations like Linear, easeInQuad, easeOutQuad, easeInOutQuad, and more.
- Duration – Set the animation duration.
- Loop Animation – Enable to repeat the animation continuously.
That’s it! You’ve successfully created a fully customized bar graph in Elementor using the PowerPack Advanced Charts widget.