Advanced Charts Widget from PowerPack for Elementor lets you add interactive, animated charts and graphs to your WordPress website—no coding required!
With a variety of chart types and extensive customization options, you can create interactive and informative data presentations in just a few clicks.
This guide will walk you through all the options and settings available in the Advanced Charts Widget!
Getting Started: How to Use the Advanced Charts Widget#
To begin, drag and drop the Advanced Charts Widget onto your Elementor page. Once placed, you'll see two main tabs in the Elementor editor:
✔ Content Tab: Configure chart types, datasets, legends, tooltips, and more.
✔ Style Tab: Customize the appearance of your charts, including grid lines, labels, colors, and animations.
Let's explore these settings in detail.
Content Tab: Configuring Your Charts#
Content Tab contains all the settings required to define your chart's structure and data.
It includes five sections:
- Advanced Charts
- Dataset
- Legend
- Tooltip
- Additional Options
Advanced Charts#
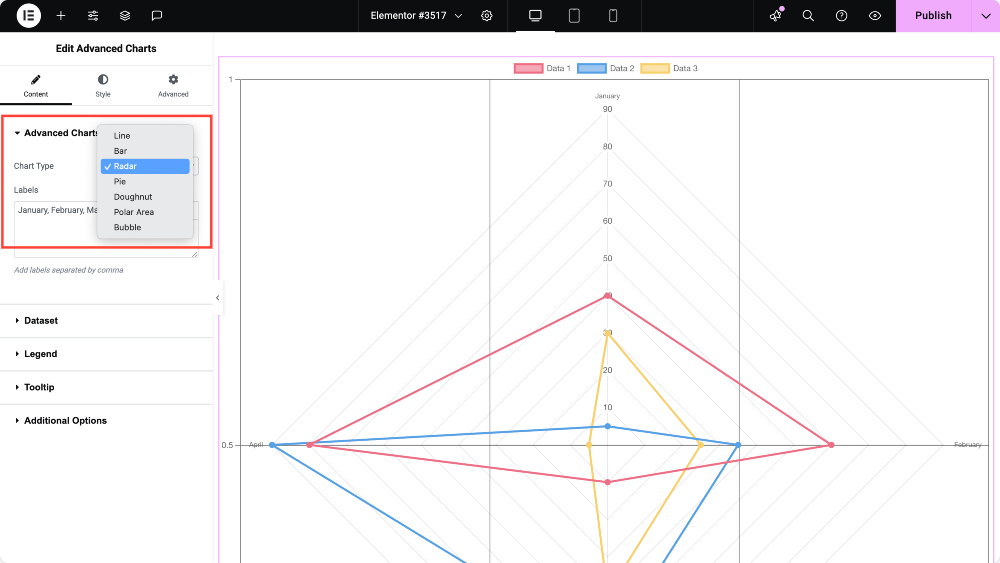
- Chart Type – Choose from 7 different chart types:
- Line
- Bar (Vertical & Horizontal)
- Radar
- Pie
- Doughnut
- Polar Area
- Bubble
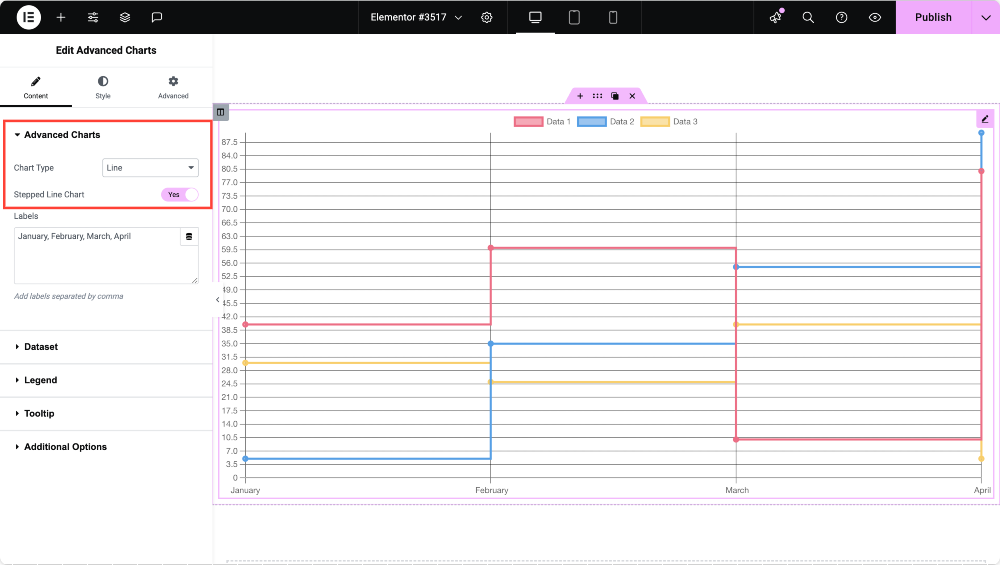
- Stepped Line Chart (for Line Charts only) – Enable or disable stepped lines for a segmented data flow.
- Bar Orientation (for Bar Charts only) – Select Vertical or Horizontal bar layouts.
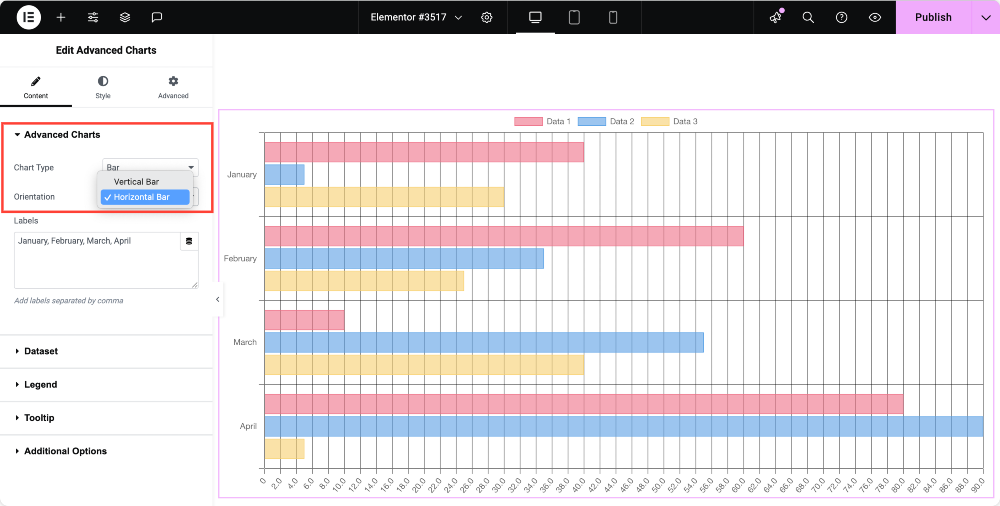
- Labels – Define category labels (e.g., January, February, March, etc.).
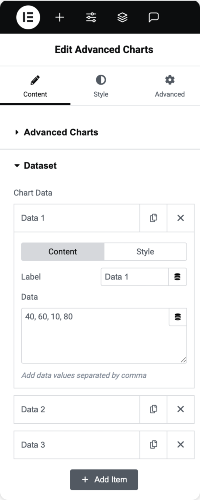
Dataset#
This section allows you to add and modify datasets for your charts.
- Chart Data – Define values for your chart.
- Customize Each Dataset – Change label names, data values, colors, and styles individually.
- Add Multiple Data Entries – Click + Add Item to include additional datasets.
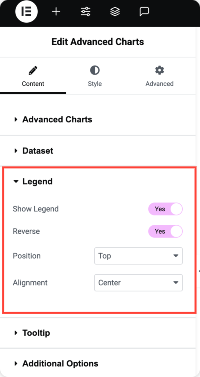
Legend#
- Show Legend – Toggle On or OFF the chart legend.
- Reverse Legend Order – Display the legend in reverse order.
- Position – Place the legend on the chart's Left, Top, Bottom, or Right side.
- Alignment – Choose Start, Center, or End alignment.
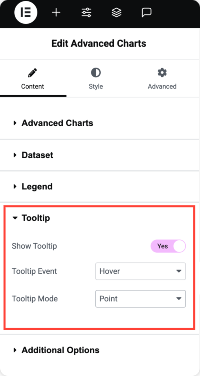
Tooltip#
- Show Tooltip – Enable tooltips to display data on Hover or Click.
- Tooltip Event – Choose how tooltips appear: Hover or Click.
- Tooltip Mode – Customize how the tooltip behaves:
- Index – Shows tooltips for all data points in the same category.
- Point – Displays data for a single point.
- Dataset – Shows the entire dataset when hovering over one point.
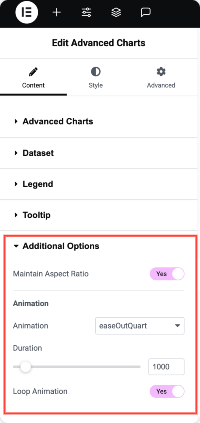
Additional Options#
- Maintain Aspect Ratio – Toggle ON to maintain the chart's original proportions.
- If disabled, you can manually define the Chart Height.
- Animation – Choose from 20+ animation effects to make your chart dynamic.
- Duration – Set the animation speed.
- Loop Animation – Enable continuous animation for an eye-catching effect.
Style Tab: Customizing the Look of Your Charts#
Style Tab allows you to fine-tune the appearance of your charts to match your website's design.
- Chart Styling: Modify the background, borders, and general chart layout.
- Grid Styling: Customize grid lines, spacing, and colors to enhance readability.
- Labels Styling: Adjust font size, colors, and alignment for the chart labels.
- Legend Styling: Control the legend's typography, spacing, and colors to improve clarity.
- Tooltip Styling: Customize tooltip background, text color, border styles, and opacity for better visibility.
Note: The available style options may vary depending on the chart type you choose in the Content Tab.
Pro Tip: The styling options are super user-friendly! Even if you don't have a design background, you can easily adjust the settings to create professional-looking charts. To help you get a better understanding, we’ve included some screenshots below showcasing the various options available in the Style tab.


That's a wrap on the Advanced Charts Widget for Elementor! We hope this guide helps you make the most out of this feature!